>USE "D:\mydocs\ys209\divorce.SYD"
SYSTAT
Rectangular file D:\mydocs\ys209\divorce.SYD,
created
Tue Apr 18, 2000 at 21:57:38, contains variables:
YEAR
DIVPOP DIVMF
UNEMP FLFPRT
MARUMF
TREND
>REM
SUBMIT 'D:\mydocs\ys209\divorce.syc' /ECHO
>select
year<=1970
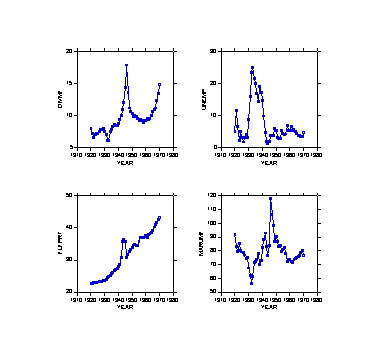
>plot
divmf unemp flfprt marumf*year/symbol line stick
Data
for the following results were selected according to:
year<=1970
>mglh
>model
divmf=constant+unemp+flfprt+marumf
>save
divres01/data
>estimate
Data
for the following results were selected according to:
year<=1970
Dep
Var: DIVMF N: 51 Multiple R: 0.866
Squared multiple R: 0.750
Adjusted
squared multiple R: 0.734 Standard error of estimate: 1.207
Effect
Coefficient Std Error Std Coef
Tolerance t P(2 Tail)
CONSTANT
-9.243 2.118
0.000 . -4.365
0.000
UNEMP
0.048 0.036
0.125 0.588 1.321
0.193
FLFPRT
0.240 0.029
0.673 0.778 8.141
0.000
MARUMF
0.137 0.019
0.607 0.727 7.097
0.000
Analysis of Variance
Source
Sum-of-Squares df Mean-Square
F-ratio P
Regression
205.765 3 68.588
47.092 0.000
Residual
68.454 47 1.456
***
WARNING ***
Case
26 is an outlier (Studentized
Residual = 3.239)
Case
27 has large leverage (Leverage =
0.347)
Case
27 is an outlier (Studentized
Residual = 3.956)
Durbin-Watson
D Statistic 0.429
First
Order Autocorrelation 0.711
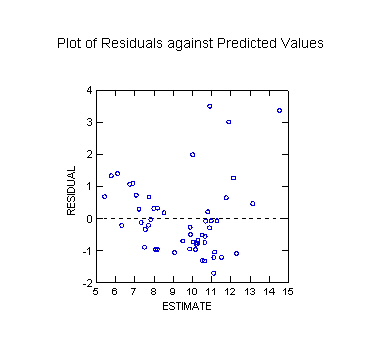
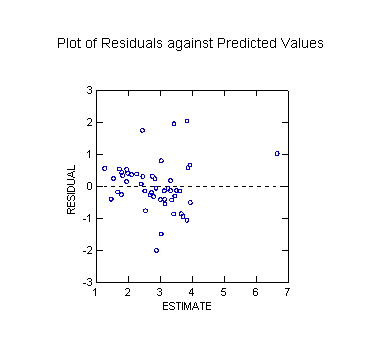
Residuals have been saved.
Plot of Residuals against Predicted Values
>use
divres01
SYSTAT
Rectangular file d:\MYDOCS\YS209\divres01.SYD,
created
Tue Apr 18, 2000 at 23:26:28, contains variables:
ESTIMATE
RESIDUAL LEVERAGE COOK
STUDENT SEPRED
YEAR
DIVPOP DIVMF
UNEMP FLFPRT
MARUMF
TREND
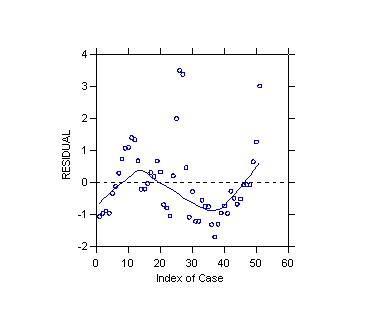
>plot residual/stick ylimit=0 smooth=lowess
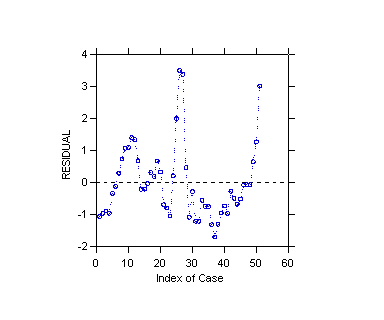
>plot
residual/stick ylimit=0 line dash=11
>use divorce
SYSTAT
Rectangular file d:\MYDOCS\YS209\divorce.SYD,
created
Tue Apr 18, 2000 at 21:57:38, contains variables:
YEAR
DIVPOP DIVMF
UNEMP FLFPRT
MARUMF
TREND
>rem
Cochrane-Orcutt procedure with r=0.711
>basic
File
in use is d:\MYDOCS\YS209\divorce.SYD.
Variables
in the SYSTAT Rectangular file are:
YEAR
DIVPOP DIVMF
UNEMP FLFPRT
MARUMF
TREND
BASIC statements cleared.
>let
ldivmf=lag(divmf)
>let
lunemp=lag(unemp)
>let
lflfprt=lag(flfprt)
>let
lmarumf=lag(marumf)
>let
pdivmf=divmf-0.711*ldivmf
>let
punemp=unemp-0.711*lunemp
>let
pflfprt=flfprt-0.711*lflfprt
>let
pmarumf=marumf-0.711*lmarumf
>run
SYSTAT
file created.
79 cases and 15 variables processed.
BASIC
statements cleared.
>page
wide
>format
3
>list
year divmf ldivmf pdivmf unemp lunemp punemp/n=10
Case number YEAR
DIVMF LDIVMF
PDIVMF UNEMP
LUNEMP PUNEMP
1 1920.000
8.000 .
. 5.200
.
.
2 1921.000
7.200 8.000
1.512 11.700
5.200 8.003
3 1922.000
6.600 7.200
1.481 6.700
11.700 -1.619
4 1923.000
7.100 6.600
2.407 2.400
6.700 -2.364
5 1924.000
7.200 7.100
2.152 5.000
2.400 3.294
6 1925.000
7.200 7.200
2.081 3.200
5.000 -0.355
7 1926.000
7.500 7.200
2.381 1.800
3.200 -0.475
8 1927.000
7.800 7.500
2.468 3.300
1.800 2.020
9 1928.000
7.800 7.800
2.254 4.200
3.300 1.854
10 1929.000
8.000 7.800
2.454 3.200
4.200 0.214
>page
narrow
>mglh
>select
year<=1970
>model
pdivmf=constant+punemp+pflfprt+pmarumf
>save
divres02/data
>estimate
Data
for the following results were selected according to:
year<=1970
1 case(s) deleted due to missing data.
Dep
Var: PDIVMF N: 50 Multiple R: 0.771
Squared multiple R: 0.594
Adjusted
squared multiple R: 0.568 Standard error of estimate: 0.776
Effect
Coefficient Std Error Std Coef
Tolerance t P(2 Tail)
CONSTANT
-2.792 0.860
0.000 . -3.247
0.002
PUNEMP
0.056 0.044
0.143 0.692 1.268
0.211
PFLFPRT
0.264 0.058
0.485 0.774 4.543
0.000
PMARUMF
0.134 0.019
0.763 0.778 7.167
0.000
Analysis of Variance
Source
Sum-of-Squares df Mean-Square
F-ratio P
Regression
40.566 3 13.522
22.436 0.000
Residual
27.724 46 0.603
***
WARNING ***
Case
27 has large leverage (Leverage =
0.707)
Durbin-Watson
D Statistic 1.016
First
Order Autocorrelation 0.422
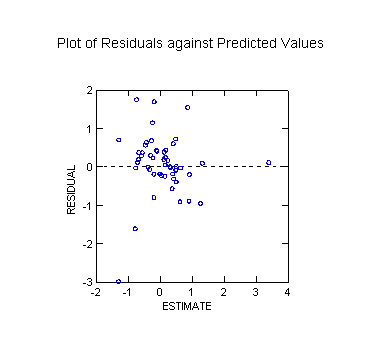
Residuals have been saved.
Plot of Residuals against Predicted Values
>rem
since the DW test still indicates autocorrelation one could
>rem
iterate the Cochrane-Orcutt procedure
>rem
instead, use the Hildreth-Lu procedure with the nonlin module
>nonlin
>model
divmf=rho*ldivmf+b0+bu*(unemp-rho*lunemp)+bf*(flfprt-rho*lflfprt),
>
+bm*(marumf-rho*lmarumf)
>estimate
Data
for the following results were selected according to:
year<=1970
Iteration
No.
Loss RHO
B0 BU
BF BM
0 .454861D+03 .101000D+00 .102000D+00 .103000D+00 .104000D+00 .105000D+00
1 .417908D+02 .834602D+00 .184446D+00 .488722D-01 .140217D+00 .879993D-01
2 .273765D+02 .823208D+00-.170591D+01 .626686D-01 .279460D+00 .135843D+00
3 .269325D+02 .825911D+00-.172630D+01 .601687D-01 .275435D+00 .134539D+00
4 .269321D+02 .824001D+00-.174633D+01 .606591D-01 .274929D+00 .134712D+00
5 .269321D+02 .824229D+00-.174405D+01 .605317D-01 .275015D+00 .134667D+00
6 .269321D+02 .824024D+00-.174617D+01 .605792D-01 .274967D+00 .134684D+00
7 .269321D+02 .824035D+00-.174603D+01 .605624D-01 .274978D+00 .134679D+00
8 .269321D+02 .823989D+00-.174650D+01 .605705D-01 .274969D+00 .134682D+00
9 .269321D+02 .824011D+00-.174627D+01 .605637D-01 .274975D+00 .134679D+00
10 .269321D+02 .824005D+00-.174633D+01 .605642D-01 .274974D+00 .134679D+00
11 .269321D+02 .824007D+00-.174631D+01 .605634D-01 .274975D+00 .134679D+00
Dependent variable is DIVMF
Zero weights, missing data or estimates reduced degrees of freedom
Source Sum-of-Squares df Mean-Square
Regression
4822.208 5 964.442
Residual 26.932
45 0.598
Total 4849.140
50
Mean
corrected 271.809 49
Raw R-square (1-Residual/Total)
= 0.994
Mean
corrected R-square (1-Residual/Corrected) =
0.901
R(observed vs predicted) square =
0.901
Wald Confidence Interval
Parameter
Estimate A.S.E. Param/ASE
Lower < 95%> Upper
RHO
0.824 0.116
7.099 0.590
1.058
B0
-1.746 1.372
-1.273 -4.510
1.017
BU
0.061 0.050
1.218 -0.040
0.161
BF
0.275 0.085
3.225 0.103
0.447
BM
0.135 0.021
6.556 0.093
0.176
>rem
calculate p-values assuming standard normal sampling dist.
>calc
2*zcf(-1.273)
0.203
>calc
2*(1-zcf(1.218))
0.223
>calc
2*(1-zcf(3.225))
0.001
>calc
2*(1-zcf(6.556))
0.000
>rem
first differences procedure
>mglh
>let
ddivmf=divmf-ldivmf
>let
dunemp=unemp-lunemp
>let
dflfprt=flfprt-lflfprt
>let
dmarumf=marumf-lmarumf
>model
ddivmf=dunemp+dflfprt+dmarumf
>estimate
Data
for the following results were selected according to:
year<=1970
1 case(s) deleted due to missing data.
Model contains no constant
Dep
Var: DDIVMF N: 50 Multiple R: 0.701
Squared multiple R: 0.492
Adjusted
squared multiple R: 0.470 Standard error of estimate: 0.787
Effect
Coefficient Std Error Std Coef
Tolerance t P(2 Tail)
DUNEMP
0.061 0.049
0.160 0.637 1.227
0.226
DFLFPRT
0.259 0.136
0.284 0.492 1.914
0.062
DMARUMF
0.132 0.023
0.880 0.470 5.807
0.000
Analysis of Variance
Source
Sum-of-Squares df Mean-Square
F-ratio P
Regression
28.177 3
9.392 15.163
0.000
Residual
29.113 47 0.619
***
WARNING ***
Case
24 has large leverage (Leverage =
0.369)
Case
27 has large leverage (Leverage =
0.593)
Case
28 is an outlier (Studentized
Residual = -4.738)
Durbin-Watson
D Statistic 1.198
First
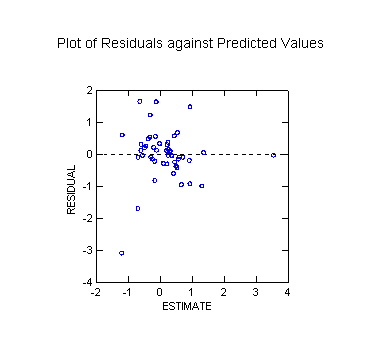
Order Autocorrelation 0.351
Plot of Residuals against Predicted Values
>rem
must also run regression with constant to get DW statistic
>model
ddivmf=constant+dunemp+dflfprt+dmarumf
>estimate
Data
for the following results were selected according to:
year<=1970
1 case(s) deleted due to missing data.
Dep
Var: DDIVMF N: 50 Multiple R: 0.699
Squared multiple R: 0.489
Adjusted
squared multiple R: 0.456 Standard error of estimate: 0.791
Effect
Coefficient Std Error Std Coef
Tolerance t P(2 Tail)
CONSTANT
0.091 0.126
0.000 .
0.725 0.472
DUNEMP
0.051 0.051
0.136 0.596 0.996
0.324
DFLFPRT
0.208 0.153
0.215 0.444 1.359
0.181
DMARUMF
0.127 0.024
0.851 0.428 5.285
0.000
Analysis of Variance
Source
Sum-of-Squares df Mean-Square
F-ratio P
Regression
27.554 3
9.185 14.678
0.000
Residual
28.784 46 0.626
-------------------------------------------------------------------------------
***
WARNING ***
Case
24 has large leverage (Leverage =
0.386)
Case
27 has large leverage (Leverage =
0.658)
Case
28 is an outlier (Studentized
Residual = -5.117)
Durbin-Watson
D Statistic 1.174
First
Order Autocorrelation 0.367
Plot of Residuals against Predicted Values
>REM
End of command batch file D:\MYDOCS\YS209\DIVORCE.SYC