. avplot phis, mlabel(state)
Source
| SS
df MS
Number of obs = 51
-------------+------------------------------
F( 5, 45) = 14.94
Model | 1973.30847 5 394.661695
Prob > F = 0.0000
Residual |
1188.64133 45 26.4142518
R-squared = 0.6241
-------------+------------------------------
Adj R-squared = 0.5823
Total | 3161.9498 50 63.2389961
Root MSE = 5.1395
------------------------------------------------------------------------------
grad | Coef. Std. Err.
t P>|t| [95% Conf. Interval]
-------------+----------------------------------------------------------------
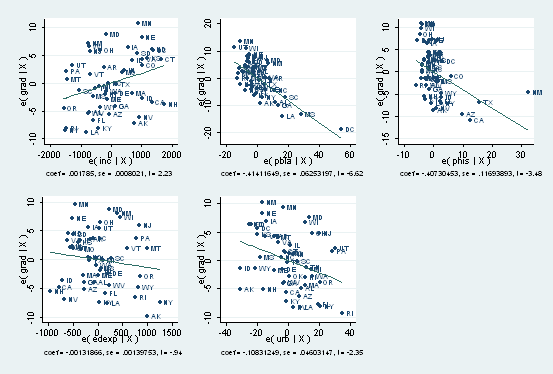
inc | .001785 .0008021
2.23 0.031 .0001695
.0034005
pbla | -.4141165 .062532 -6.62
0.000 -.5400623 -.2881706
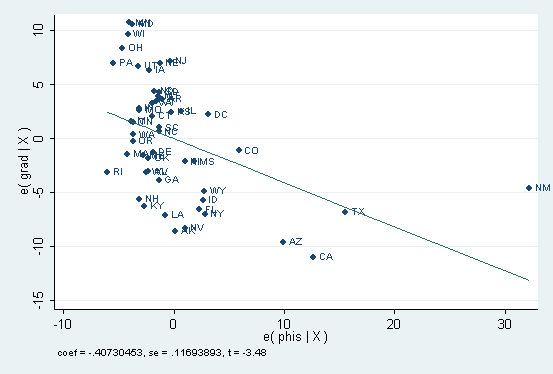
phis | -.4073045 .1169389 -3.48
0.001 -.6428316 -.1717774
edexp | -.0013187 .0013975 -0.94
0.350 -.0041334 .0014961
urb | -.1083125 .0460315 -2.35
0.023 -.2010246 -.0156004
_cons | 69.04199 5.372707 12.85
0.000 58.2208 79.86318
------------------------------------------------------------------------------
. avplots, mlabel(state)
. avplot phis, mlabel(state)