>REM End of command batch file D:\MYDOCS\YS209\DEPRESS.SYC
>ESAVE "D:\mydocs\ys209\Survey2.syd"
>USE "D:\mydocs\ys209\Survey2.syd"
SYSTAT
Rectangular file D:\mydocs\ys209\Survey2.syd,
created
Mon Oct 10, 1994 at 15:34:42, contains variables:
ID
SEX AGE
MARITAL EDUCATN
EMPLOY
INCOME
RELIGION BLUE
DEPRESS LONELY
CRY
SAD
FEARFUL FAILURE
AS_GOOD HOPEFUL
HAPPY
ENJOY
BOTHERED NO_EAT
EFFORT BADSLEEP
GETGOING
MIND
TALKLESS UNFRNDLY DISLIKE
TOTAL CASECONT
DRINK
HEALTHY DOCTOR
MEDS BED_DAYS
ILLNESS
CHRONIC
MARITAL$ SEX$
AGE$ EDUC$
>REM
SUBMIT 'D:\mydocs\ys209\depress.syc' /ECHO
>let
female=0
>if
sex=2 then let female=1
>let
cath=0
>if
religion=2 then let cath=1
>let
jewi=0
>if
religion=3 then let jewi=1
>let
none=0
>if
religion=4 then let none=1
>rem
omitted category is protestant or other (only 2 cases)
>let
l10inc=l10(income+1)
>mglh
>model
total=constant+age+female+l10inc+educatn+cath+jewi+none
>save
depres01/model
>estimate
Dep
Var: TOTAL N: 256 Multiple R: 0.378694
Squared multiple R: 0.143409
Adjusted
squared multiple R: 0.119231 Standard error of estimate: 8.361515
Effect
Coefficient Std Error Std Coef
Tolerance t P(2 Tail)
CONSTANT
19.776246 3.083963 0.000000
. 6.41261 0.00000
AGE
-0.080870 0.033446 -0.145591
0.952675 -2.41794 0.01633
FEMALE
2.475360 1.091627 0.136720
0.950133 2.26759 0.02422
L10INC
-5.842862 1.826501 -0.204619
0.844191 -3.19894 0.00156
EDUCATN
-0.766779 0.436350 -0.112592
0.841352 -1.75726 0.08011
CATH
0.940902 1.438833 0.040625
0.894977 0.65393 0.51376
JEWI
4.955468 1.915932 0.159361
0.909842 2.58645 0.01027
NONE
3.544925 1.403983 0.160391
0.855958 2.52491 0.01220
Analysis of Variance
Source
Sum-of-Squares df Mean-Square
F-ratio P
Regression
2902.844806 7 414.692115
5.931381 0.000002
Residual
1.73389E+04 248 69.914940
***
WARNING ***
Case
216 is an outlier (Studentized
Residual = 3.751558)
Case
220 is an outlier (Studentized
Residual = 4.040754)
Case
256 is an outlier (Studentized
Residual = 4.586381)
Durbin-Watson
D Statistic 0.725
First
Order Autocorrelation 0.599
Residuals have been saved.
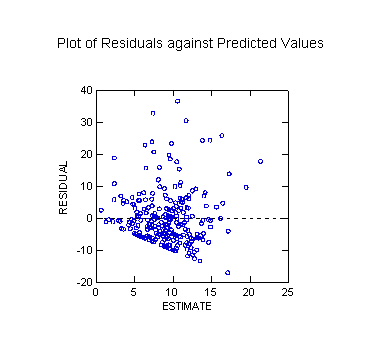
Plot
of Residuals against Predicted Values
>REM
End of command batch file D:\MYDOCS\YS209\DEPRESS.SYC
>ESAVE
"D:\mydocs\ys209\Survey2.syd"
***WARNING***
The
file
D:\mydocs\ys209\Survey2.syd
was
read for processing, and its contents have been replaced by saving
the
processed data into it.
256 cases and 46 variables processed and saved.
File D:\MYDOCS\YS209\DEPRES01.SYD
>USE "D:\mydocs\ys209\depres01.SYD"
SYSTAT
Rectangular file D:\mydocs\ys209\depres01.SYD,
created
Fri Apr 07, 2000 at 14:06:10, contains variables:
ESTIMATE
RESIDUAL LEVERAGE COOK
STUDENT SEPRED
TOTAL
X(1..7)
>stats
>stem
residual
>rem this stem &
leaf plot is not necessary...
Stem and Leaf Plot of variable: RESIDUAL, N = 256
Minimum: -17.170419
Lower hinge: -5.478359
Median: -1.533239
Upper hinge: 3.398949
Maximum: 36.363076
-1 7
-1
-1 32
-1 11100000
-0 999999988888888
-0 77777777666666666666666666
-0 H 55555555555555555555555554444444444444
-0 333333333333333332222222222222222
-0 M 11111111111111000000000000000000
0 0000000000000000111111
0 H 222222222222333333
0 44444444455555555555
0 666666667777
0 889999
1 0001
1 3
1 555
* * * Outside Values * * *
1 77889
2 0233445
3 026
>stem estimate
Stem and Leaf Plot of variable: ESTIMATE, N = 256
Minimum: 0.688964
Lower hinge: 6.956637
Median: 9.185700
Upper hinge: 11.279578
Maximum: 21.430098
0 6
1 36
2 23349
3 123556
4 002345577889999
5 0122334555566667888
6 H 022344556677778999
7 00122223333333345556677788
8 0011111223334556667789999
9 M 000000111112222222344445555566666788888
10 0000112333444445555667788999
11 H 00000222233566778888888999
12 0111112344555678
13 0111335678999
14 02366899
15 7
16 245
17 123
* * * Outside Values * * *
19 5
21 4
>rem
to get median of yhat to define the 2 groups
>select
estimate<9.1857
STATS
- Statistics
>stem residual
Data
for the following results were selected according to:
estimate<9.1857
Stem
and Leaf Plot of variable: RESIDUAL, N = 128
Minimum: -9.114721
Lower hinge: -4.847998
Median: -1.639777
Upper hinge: 2.726628
Maximum: 32.560978
-0 9988
-0 77766666666
-0 H 555555555555554444444444
-0 H 3333333333332222222222
-0 M 11111111110000000000
0 0000000001111
0 H 222233
0 44444555555
0 666777
0 99
1 01
* * * Outside Values * * *
1 558
2 023
3 2
>rem
median residual is -1.639777 for group1
>select
estimate>=9.1857
>stem residual
Data
for the following results were selected according to:
estimate>=9.1857
Stem
and Leaf Plot of variable: RESIDUAL, N = 128
Minimum: -17.170419
Lower hinge: -6.428893
Median: -1.533239
Upper hinge: 4.540719
Maximum: 36.363076
-1 7
-1
-1 32
-1 11100000
-0 99999888888
-0 H 777776666666666
-0 H 55555555555444
-0 33333222222
-0 M 111100000000
0 000000011
0 222222223333
0 H 444455555
0 666667
0 8899
1 00
1 3
1 5
1 77
1 89
* * * Outside Values * * *
2 3445
3 06
>rem
median residual is -1.533239 for group 2
>select
>if
estimate<9.1857 then let absdev=abs(residual+1.639777)
>if
estimate>=9.1857 then let absdev=abs(residual+1.533239)
>select
estimate<9.1857
>stat absdev/mean
Data
for the following results were selected according to:
estimate<9.1857
ABSDEV
Mean
4.712982
>rem
mean absolute deviation for group 1 is 4.712982
>select
estimate>=9.1857
>stat absdev/mean
Data
for the following results were selected according to:
estimate>=9.1857
ABSDEV
Mean
6.894598
>rem
mean absdev for group 2 is 6.894598
>select
>if
estimate<9.1857 then let sqadev=(absdev-4.712982)^2
>if
estimate>=9.1857 then let sqadev=(absdev-6.894598)^2
>stat/sum
ESTIMATE RESIDUAL LEVERAGE
COOK STUDENT
Sum
2344.000000 0.000000 8.000000
1.019045 0.930426
SEPRED TOTAL
X(1) X(2)
X(3)
Sum
368.405049 2344.000000 1.04540E+04 152.000000 323.262828
X(4) X(5)
X(6) X(7)
ABSDEV
Sum
916.000000 46.000000 23.000000 52.000000
1485.770161
SQADEV
Sum
9055.894883
>rem
sum of sqadev is 9055.894883
>calc
sqr(9055.894883/248)
6.042823
>rem
s=6.042823
>calc
(4.712982-6.894598)/(6.042823*sqr((1/128)+(1/128)))
-2.888208
>rem
tL* is -2.888208
>calc
2*tcf(-2.888208,248)
0.004217
>rem
p-value of test is 0.004217
>rem
therefore reject hypothesis of constant variance
>ESAVE "D:\mydocs\ys209\depres01.SYD"
***WARNING***
The
file
D:\mydocs\ys209\depres01.SYD
was
read for processing, and its contents have been replaced by saving
the
processed data into it.
256 cases and 16 variables processed and saved.