Adjusted squared multiple R: 0.331304 Standard error of estimate: 13.482665
Effect Coefficient Std Error Std Coef Tolerance t P(2 Tail)
CONSTANT 31.089437
5.323809 0.000000 .
_______ _______
OUTRATIO
0.765389 0.189237 0.594032
1.000000 _______ _______
Analysis of Variance
Source Sum-of-Squares df Mean-Square F-ratio P
Regression
2973.750962 1 2973.750962 __________
_________
Residual
5453.467788 30 181.782260
-------------------------------------------------------------------------------
*** WARNING ***
Case
15 has large leverage (Leverage = 0.328486)
Durbin-Watson D Statistic 1.853
First Order Autocorrelation -0.018
1. Test hypothesis that b1
<> 0
2. Test hypothesis that b1
<> 0.5
3. Test hypothesis that b1
> 0
4. Calculate a CI for b1
5. Do the equivalent of 1, 2 (b0
<> 20), 3, and 4 for b0
6. F test of the significance of
the entire regression model (overkill in a simple regression but useful
in multiple regression)
7. CI for the mean response ^Yh
(for a single ^Yh)
8. CI for the mean response for several
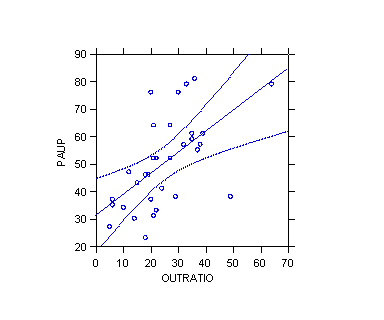
^Yh: Working-Hotelling confidence band (see picture)
9. Prediction interval for Yh(new)