The Box Plot

The box plot is a graphical summary of the distribution of a variable originally developed by John Tukey (Tukey 1977; see also the Sygraph manual, Wilkinson 1990:164-171).  The vertical line near the center of the box corresponds to the median of the distribution.  The left and right edges of the box correspond to the 25th percentile (first quartile) and 75th percentile (third quartile), respectively.  (The 25th and 75th percentiles are also termed lower hinge and upper hinge, respectively.)  The length of the box therefore corresponds to the interquartile range (IQR), a measure of dispersion computed as the third quartile minus the first quartile.  Stars are used to mark observations beyond 1.5 IQRs from either side of the box.  Such observations are considered to be minor outliers.  Circles mark observations, labeled major outliers, that have values beyond 3 IQRs from either side of the box.  The lines, or whiskers, drawn from the sides of the box extend to the most outlying value within 1.5 IQR from the sides.
    Indentations, or notches, are an optional feature of the box plot.  The notches mark the confidence intervals for the median developed by McGill, Tukey, and Larsen (1978).  In comparing two boxplots along the same scale, If the intervals around two medians do not overlap, the two population medians can be considered different with about 95 percent confidence.
    The box plots below, with the corresponding stem and leaf plots, illustrate a distribution that is more or less compact and symmetric, unlikely to cause problems in regression analysis (V195: Female life expectancy, 1975), and another distribution characterized by severe skew to the right and the presence of major outliers (V120: Energy consumption per capita, 1975).

REFERENCES:

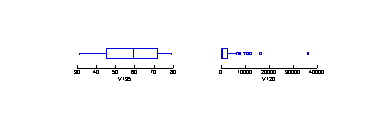
 STEM AND LEAF PLOT OF VARIABLE:     V195    , N =   142
 
 MINIMUM IS:       31.000
 LOWER HINGE IS:       45.000
 MEDIAN IS:        59.500
 UPPER HINGE IS:       72.000
 MAXIMUM IS:       79.000
 
                3   1
                3   566789
                4   0000001122223333444
                4 H 555555555566667788889
                5   001122223344
                5 M 555556678999
                6   0011233334
                6   5555666677777777888
                7 H 00011122222333444444444
                7   5555555666677777889
 

          STEM AND LEAF PLOT OF VARIABLE:     V120    , N =   148
 
 MINIMUM IS:        0.000
 LOWER HINGE IS:      131.500
 MEDIAN IS:       560.500
 UPPER HINGE IS:     2697.000
 MAXIMUM IS:    36111.000
 
                0 H 00000000000000000000000000000011111111111111111122222222233*
                0 M 55555666666677799999
                1   000011122223
                1   7799
                2   012
                2 H 5677
                3   013344
                3   6789
                4   01
                4   777
                5   000123
                5   57
                6   014
          ***OUTSIDE VALUES***
                7   148
                9   8
               10   9
               11   5
               12   0
               16   1
               36   1


Last modified 16 Feb 2000