>let summi60 = sumnews - 60
>let sumge60 = 0
>if sumnews >= 60 then let sumge60 = 1
>format 3
>regress
>model apply = constant + sumnews + summi60*sumge60
>estimate
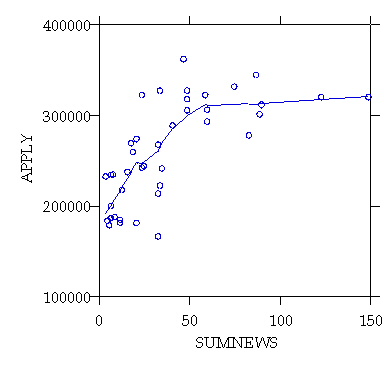
>plot apply*sumnews/stick=out smooth=lowess short
>let
summi60 = sumnews - 60
>let
sumge60 = 0
>if
sumnews >= 60 then let sumge60 = 1
>format
3
>regress
>model
apply = constant + sumnews + summi60*sumge60
>estimate
Dep
Var: APPLY N: 40 Multiple R: 0.781
Squared multiple R: 0.610
Adjusted
squared multiple R: 0.589 Standard error of estimate: 36043.834
Effect
Coefficient Std Error Std Coef
Tolerance t P(2 Tail)
CONSTANT
189663.521 11168.650
0.000 . 16.982
0.000
SUMNEWS
2187.969 329.938
1.319 0.266 6.631
0.000
SUMMI60
*SUMGE60
-2278.565 607.717
-0.746 0.266 -3.749
0.001
Analysis of Variance
Source
Sum-of-Squares df Mean-Square
F-ratio P
Regression
7.53208E+10 2 3.76604E+10
28.988 0.000
Residual
4.80688E+10 37 1.29916E+09
-------------------------------------------------------------------------------
***
WARNING ***
Case
38 has large leverage (Leverage =
0.568)
Durbin-Watson
D Statistic 1.205
First
Order Autocorrelation 0.376
>begin
>plot
apply*sumnews/stick=out xmin=0 xmax=150 ymin=100000 ymax=400000
>fplot
y = 189663.521 + 2187.969*x -2278.565*(x - 60)*(x >= 60);,
>stick=out
xmin=0 xmax=150 ymin=100000 ymax=400000
>end
